Linux 驱动之 ALSA(七)XRUN
XRUN 是缓冲区不足或溢出,X 代表不足或溢出。在这两种情况下,都表明系统速度不够快,未能及时处理来自 ALSA 音频缓冲区的数据,因此丢失了一些数据。当我们以非常小的缓冲区大小运行时,声卡应该非常快地处理传入缓冲区的数据,否则就溢出 overrun 了。有些芯片无法适应较小的缓冲区大小,因此我们必须增加缓冲区长度以减轻声音芯片的工作量。通常,xruns 可以听到爆裂声或爆裂声。
在录音例子中,如果应用程序读取数据不够快,循环缓存区将会被新的数据覆盖。这种数据的丢失被称为"over run" 在回放例子中,如果应用程序写入数据到缓存区中的速度不够快,缓存区将会"饿死"。这样的错误被称为"under run"
/Proc
ALSA 提供了一种通过 proc 记录和调试 xrun 的方法:
1 | Device Drivers ---> <*> Sound card support ---> <*> Advanced Linux Sound Architecture ---> [*] Sound Proc FS Support |
/proc/asound/card#/pcm0p/xrun_debug
将“#”替换为 card number。该 proc 文件可以启用各种调试工具。必须在内核中启用 CONFIG_SND_PCM_XRUN_DEBUG、CONFIG_SND_VERBOSE_PROCFS、CONFIG_SND_DEBUG 选项(如果 xrun_debug proc 文件存在 - 该功能已启用)
1 | 1 Basic debugging - show xruns in ksyslog interface |
To enable more features just do sum values of above (for example 1+2=3).
Some good value combinations:
1 | # Enable basic debugging and dump stack |
1 | # Enable basic debugging and dump stack, check hardware pointer on the period update |
1 | # Enable basic debugging and dump stack, check hardware pointer on all updates |
1 | # Enable basic debugging, do jiffies check and enable one shot dump of last 10 ring buffer positions |
1 | # Enable basic debugging, do jiffies check and dump position on each period and hardware pointer update calls |
默认情况下,在进入 XRUN 状态时会停止 DMA 传输,直到有 available 空间可写入(overrun 时),或者直到有数据写入(underrun 时)。 但是用户空间可以通过配置 silence_threshold 来继续播放缓冲区的重复的音频数据或静音数据(silence_size 为填充的大小),当空余空间超过 silence threshold 时,就 hardware buffer 写入 silence。
Trace
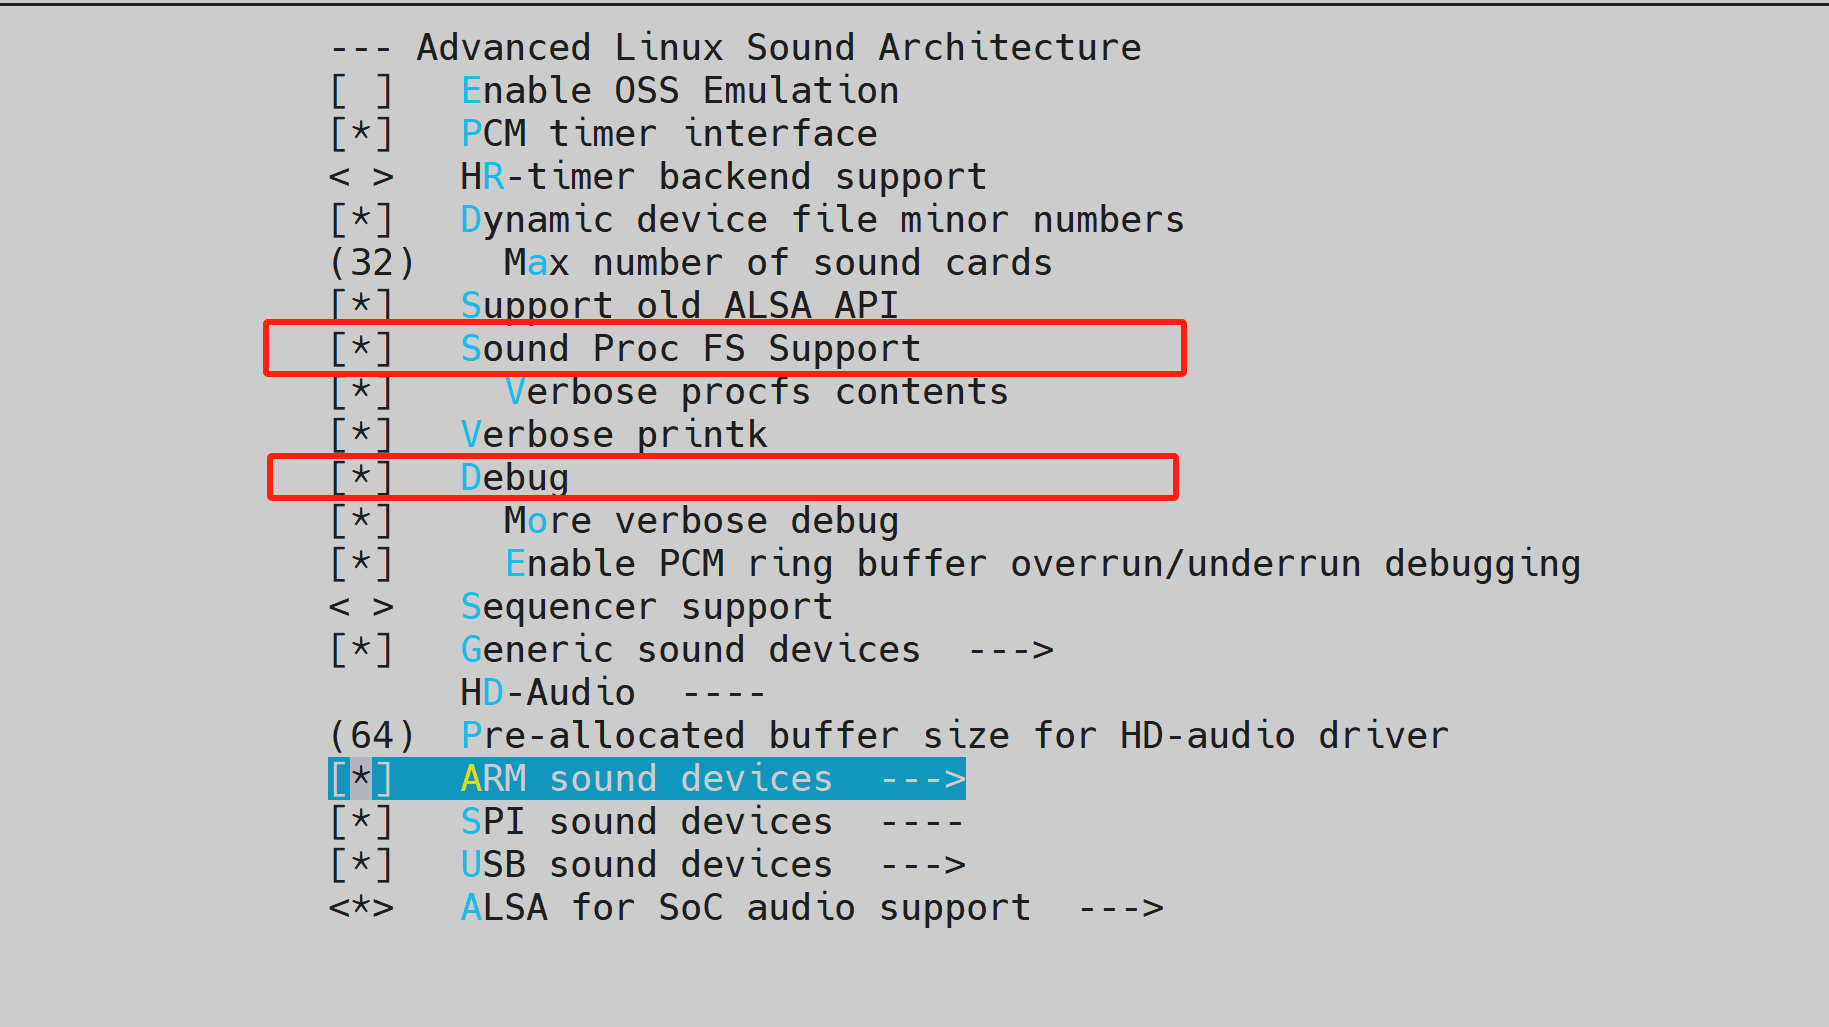
在 menuconfig 中开启以下选项
1
2
3
4
5
6
7
8
9
10Device Drivers
---> <*> Sound card support
---> <*> Advanced Linux Sound Architecture
---> [*] Sound Proc FS Support
Device Drivers
---> <*> Sound card support
---> <*> Advanced Linux Sound Architecture
---> [*] Debug
---> [*] Enable PCM ring buffer overrun/underrun debugging在设备中挂在 debugfs 和使能 audio 相关 trace
1 | mount -t debugfs none /sys/kernel/debug/ |
- 执行 arecord,出现 xrun 后:
1 | cat /sys/kernel/debug/tracing/trace |
- 以下是执行
1 | arecord -Dhw:2,0 -r 44100 -c 8 -f S32_LE /data/record.wav |
复现到的一次 xrun 问题:
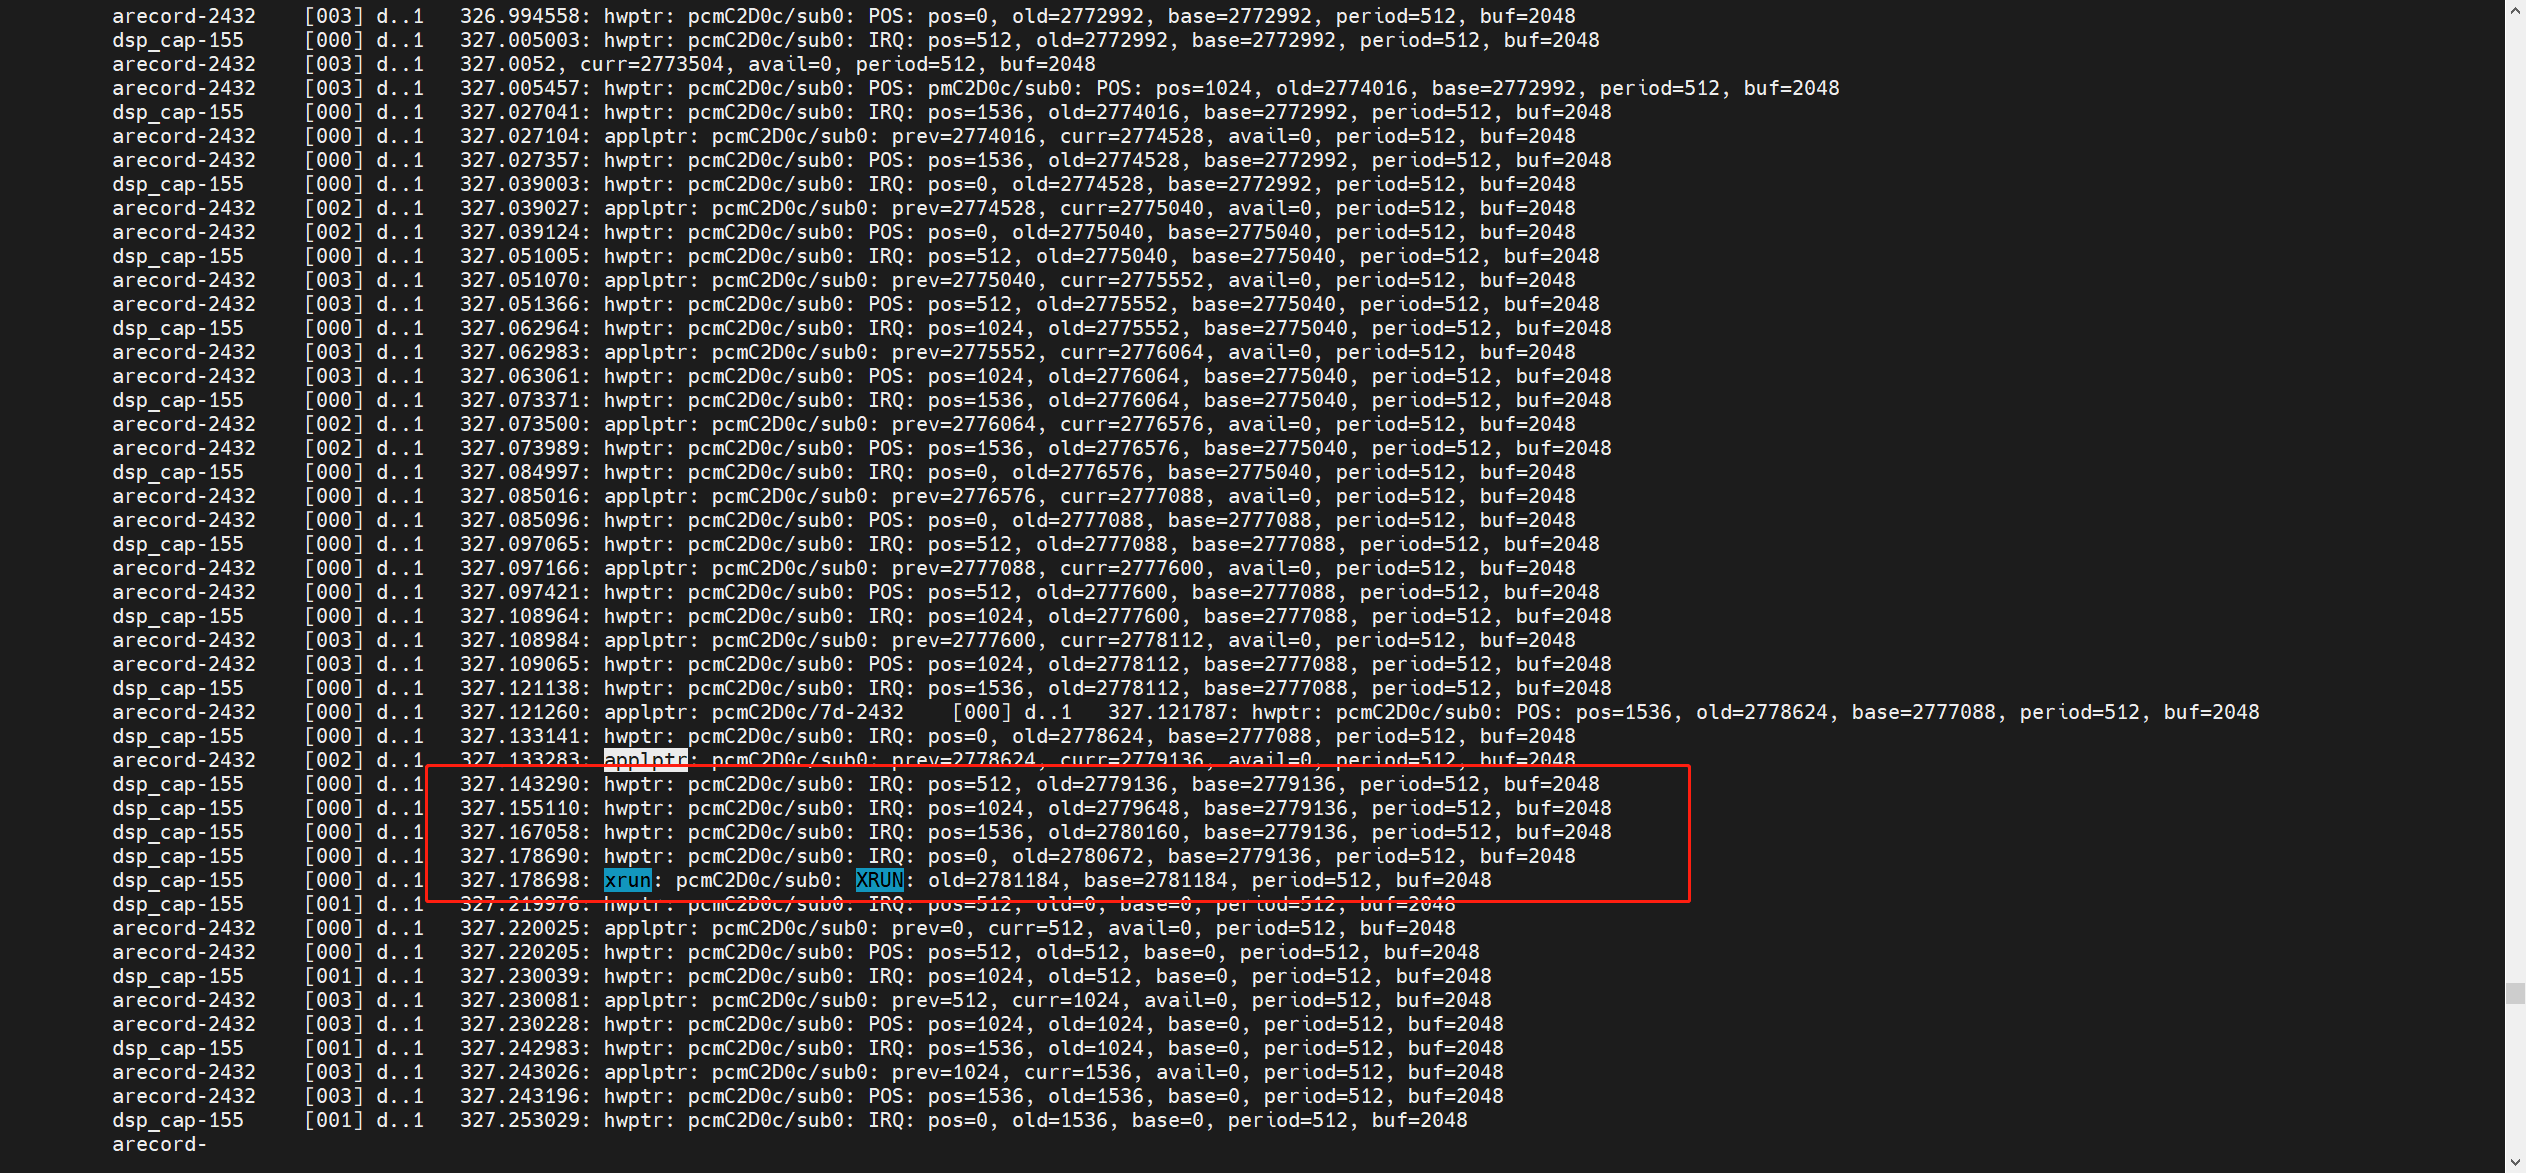
这里 hwptr 的 old 就是 hwptr 指针,applptr 的 current 就是 applptr 指针位置,可以看到发生 xrun 前面 hwptr=2781184,applyptr=2779136。系统中 buffer_size = 2048(frames), 而这里 hwptr 指针领先 applptr 指针 2048 个 frame,说明 runtime 里的 dma buffer 已经满了(overrun),应用没有及时取走数据。下一步就可以分析应用为什么没有及时取走数据了。
关于 HW Buffer
当 app 在调用 snd_pcm_writei 时,alsa core 将 app 传来的数据搬到 HW buffer(即 DMA buffer)中,alsa driver 从 HW buffer 中读取数据传输到硬件播放。
ALSA buffer 是采用 ring buffer 来实现的。ring buffer 有多个 HW buffer 组成。
HW buffer 一般是在 alsa driver 的 hw_params 函数中分配的一块大小为 buffer size 个 frames 的 DMA buffer.
之所以采用多个 HW buffer 来组成 ring buffer, 是防止读写指针的前后位置频繁的互换(即写指针到达 HW buffer 边界时,就要回到 HW buffer 起始点)。
ring buffer = n * HW buffer. 通常这个 n 比较大,在数据读写的过程中,很少会出现读写指针互换的情况。
下图是 ALSA buffer 的实现以及读写指针更新的方法:
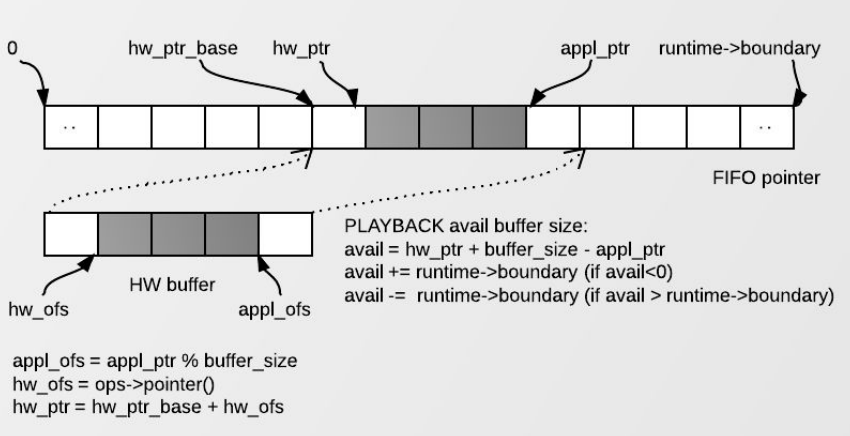
- hw_ptr_base 是当前 HW buffer 在 Ring buffer 中的起始位置。当读指针到达 HW buffer 尾部时,hw_ptr_base 按 buffer size 移动
- hw_ptr 即 HW buffer 的 driver 操作指针
- appl_ptr 即 HW buffer 的应用操作指针
- boundary 即 Ring buffer 边界。
- hw_ofs 是 driver 指针在当前 HW buffer 中的位置。由 alsa driver 的 pointer() 返回
- appl_ofs 是应用操作指针在当前 HW buffer 中的位置
- hw_ptr 的更新是通过调用 snd_pcm_update_hw_ptr0 完成。此函数在 app 写数据时会调用,也会在硬件中断时通过 snd_pcm_peroid_elapsed 调用
实验
1 | arecord -Dhw:2,0 -c 8 -r 44100 -f S32_LE /dev/null |
以上两种方式都不会出现 overrun,这种一般都是 IO 性能问题。 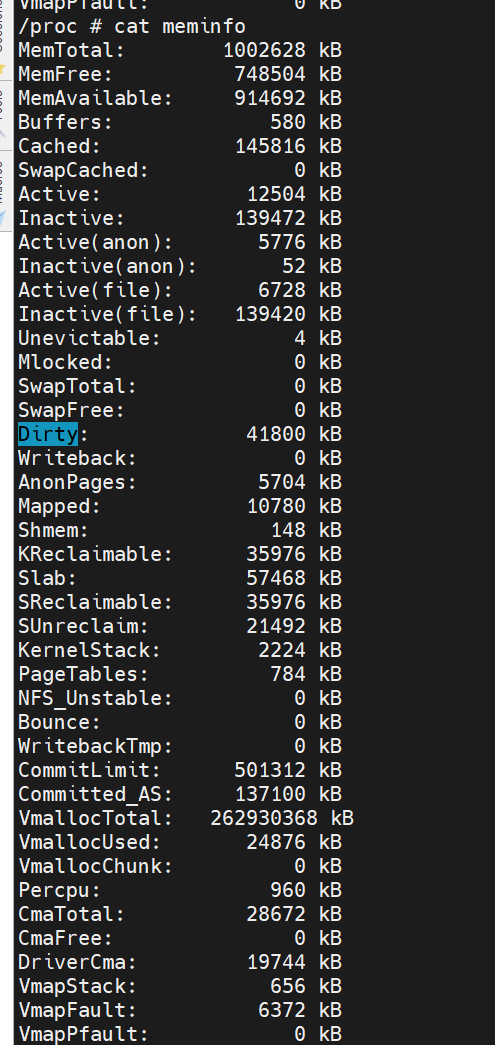
cat meminfo 节点,发现系统会在缓存 41M 左右的时候进行刷 dirty page。
对于 44100 采样率、8channel、32bit 位深,每秒钟产生的数据量为 4410084Byte = 1411200Byte = 1.345MByte
可以通过修改刷 dirty page 的频率来降低出现 overrun 的概率:
1 | echo 7056000 > /proc/sys/vm/dirty_background_bytes |
修改成这样大概 5s 左右刷一次数据,这样 overrun 概率大大降低。
常见原因
- Linux CFS(完全公平的调度程序)
- 具有 SCHED_FIFO 调度的高优先级线程
- 优先级倒置
- 长时间调度延迟
- 长时间运行的中断处理程序
- 长时间中断禁用
- 电源管理
- 安全内核
参考文献
https://source.android.com/docs/core/audio/latency/contrib?hl=zh-cn
https://www.alsa-project.org/wiki/XRUN_Debug